| Topic | What the supported facts say | Planning use |
|---|---|---|
| Trading hours | Crypto trades 24 hours a day, seven days a week, unlike traditional stock markets. | There is no closing bell, so note the time of any price you quote or compare. |
| Price formation | A coin’s price is determined by the equilibrium between supply and demand. | Read a price move as demand and supply shifting at that moment, not as a fixed verdict on value. |
| Bitcoin supply | Bitcoin has a hard cap of 21 million coins, and halvings cut new supply in half. | Treat the supply schedule as known in advance, but not as a guarantee about price direction. |
| Liquidity | Liquidity is the ease of buying or selling an asset without significantly impacting its price. | Favour deeper markets for larger orders. Thin markets can swing on small trades. |
| Volatility | Crypto markets are notorious for rapid and dramatic price swings. | Plan for sharp moves in either direction and size decisions accordingly. |
Definitions and figures in the table come from Infinox’s crypto trading guide and Keyrock’s market-making guide.
How do crypto markets work? Buyers and sellers trade continuously, prices settle where supply meets demand, and liquidity decides how easily an order fills without moving the price. Every figure you read is a snapshot of that moment.
This overview follows the order a newcomer meets the market: hours, trade mechanics, liquidity, price drivers, supply, and the contrast with stocks. For a closer look at the drivers, what moves crypto prices goes deeper than the summary below.
Trading hours and the always-open market
Crypto markets do not close. According to Infinox, the crypto market operates 24 hours a day, seven days a week, unlike traditional stock markets. That single difference shapes much of how people watch, trade and talk about prices.
No closing bell
A stock exchange has an opening and a closing moment, and a gap between them when nothing trades. Crypto has no such gap. Weekends and holidays are as live as any weekday, and a price displayed on a screen is simply the latest reading rather than a final result for the day.
The practical consequence is that any price you quote needs a time attached. If you compare today’s figure with an earlier one, note when each was taken. The same discipline applies to every number here: where a value is a snapshot, treat it as one and check live data before acting.
What continuous trading means for you
An always-open market suits people who cannot watch screens during working hours, because they can place or adjust orders whenever they are free. It also means that news can reach the market at any hour, and prices can react while you are away. Sentiment, news and regulatory announcements are named as price movers in the Infinox guide, and none of them wait for a business day.
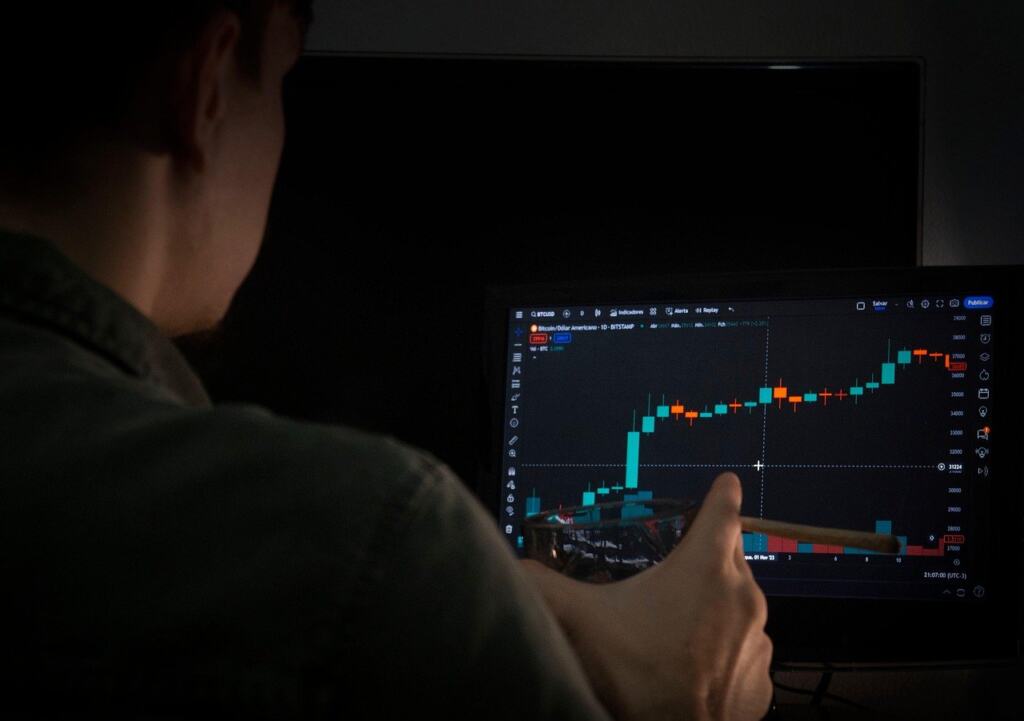
Whether some hours are better than others for placing a trade is a separate question, and best time to trade crypto addresses it. For planning purposes, the supported point here is simply that the market never shuts, so decide in advance how often you will check it and whether you will use resting orders instead of watching.

How trades happen: spot orders, the order book and the spread
Most beginners meet crypto through spot trading, which Coinbase describes as buying and selling digital currencies at their current market prices. Understanding what happens between pressing the button and seeing a fill explains many of the surprises newcomers report.
Orders and the order book
According to Coinbase’s learning page, a spot order is executed as soon as it matches a corresponding order in the order book. The order book is the list of buy and sell orders waiting at different prices. Your trade does not meet a market in the abstract. It meets another participant’s order, which is why the presence of willing counterparties matters so much.
Spot trading also keeps the idea simple. You are exchanging one asset for another at the going price, and the transaction is recorded on a blockchain, described by Coursera as an unchangeable ledger that tracks and records assets and trades. No bank is needed to verify the transaction, because the ledger does that job.
Bid, ask and the gap between them
Infinox defines the spread as the difference between the highest price a buyer is willing to pay and the lowest price a seller will accept. That gap is a cost you meet whenever you buy and then sell, and it tends to tell you something about how crowded the market is. A narrow gap suggests many participants are close in price. A wide gap suggests the opposite.
When the book is thin or moving fast, the price you receive can differ from the price you expected. Traders call that effect slippage, and what is slippage in crypto explains how it connects to the spread. For a larger order, check the spread before you act, and consider splitting the order rather than sending it all at once.
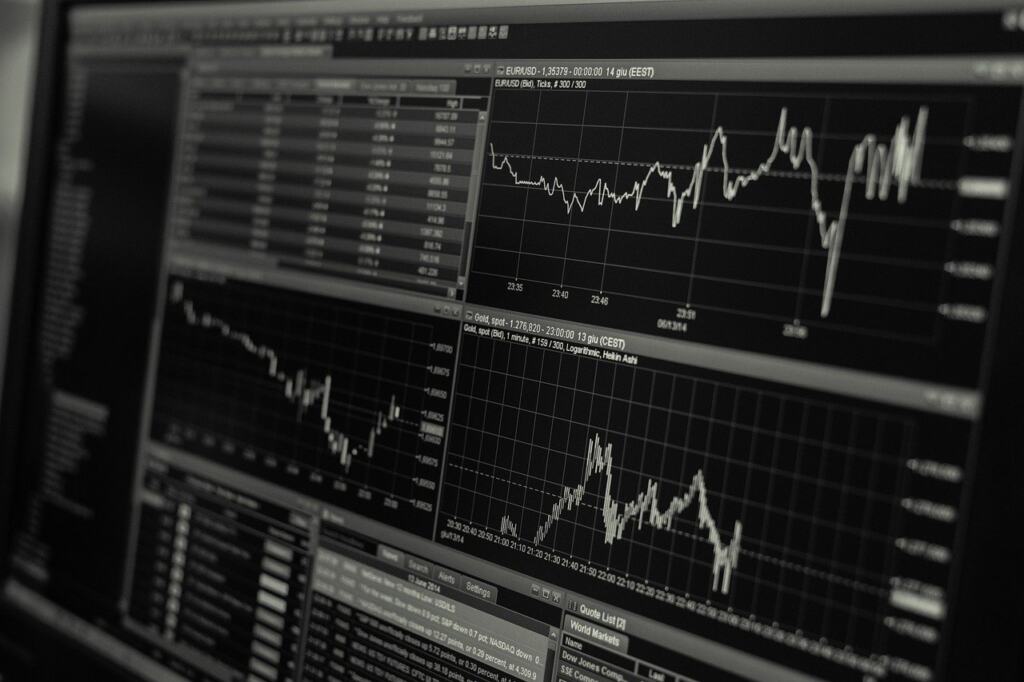
Trading pairs and stablecoins
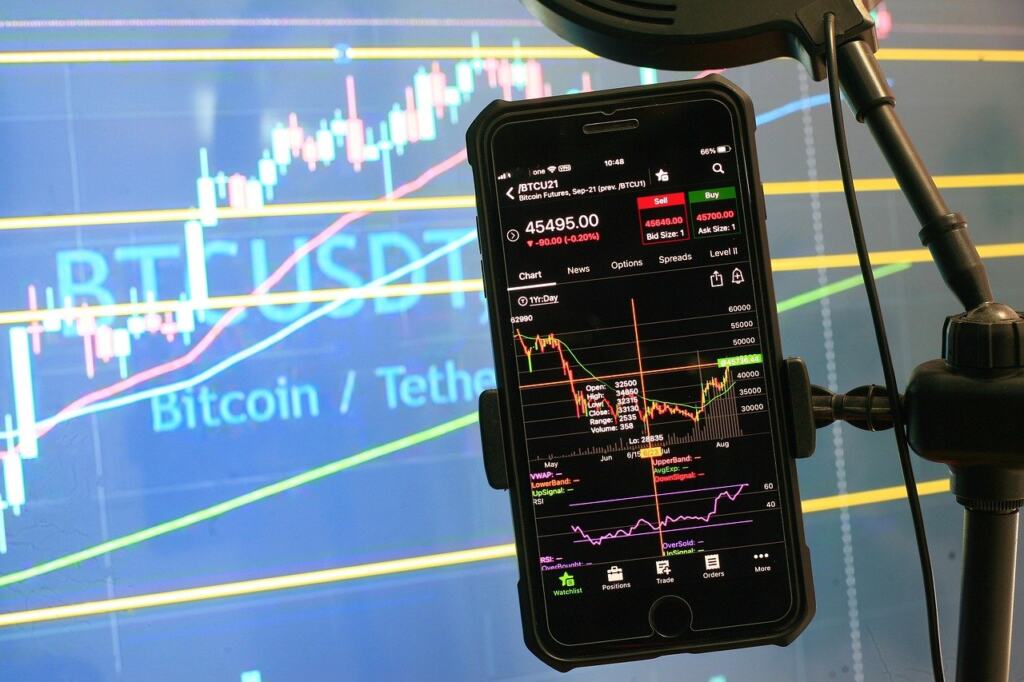
Crypto prices are quoted against something, often another token. On many charts the quote side is a stablecoin, a token designed to hold a steadier value than most other crypto. A label such as BTCUSDT, for instance, pairs bitcoin with Tether, so the price reads as bitcoin measured in that stablecoin.
Coursera notes that traditional currency is backed by a government, while cryptocurrency has no government, bank or financial institution controlling it. That contrast is worth remembering when you meet a stablecoin: how any particular one maintains its value is the issuer’s own matter, so read the issuer’s documentation before treating it as equivalent to cash.
Liquidity, volume and depth
Liquidity decides how comfortably you can enter or leave a position. It is also the entity most often confused with volume, so it helps to separate them.
What liquidity is
Keyrock defines liquidity as the ease with which an asset can be bought or sold in the market without significantly impacting its price. A liquid market absorbs your order and the price barely moves. An illiquid one reacts visibly. For a fuller treatment, read what is liquidity in crypto.
The same guide explains that less liquid assets can experience substantial price swings, and that the presence of market makers helps maintain liquidity, which decreases volatility and price impact. In other words, the price you see on a thinly traded coin is more fragile than the price on a heavily traded one, even if both are displayed in the same way on a screen.
Why liquidity changes your choices
The decision rule is simple. If you plan a modest order in a deep market, liquidity is rarely your main concern. If you plan a larger order, or you are looking at a smaller coin, liquidity becomes a primary question. Check the spread, look at how much sits near the current price in the order book, and consider whether you could exit as easily as you enter.
Where volume fits
Volume reports how much has traded over a period, and it is a useful companion to liquidity rather than a replacement for it. A busy market tends to be easier to trade in, but a single volume figure does not tell you how much depth sits at each price. What is trading volume in crypto explains how to read it and where it can mislead.
Aggregated data sites publish volume and price tables, but those numbers change constantly and sources can differ in how they count. Use them to compare coins against each other on the same day, and avoid carrying a figure from an earlier day into a decision made later.
What drives crypto prices
Infinox states that the price of a cryptocurrency is ultimately determined by the equilibrium between supply and demand. Everything else on the list of drivers works by shifting one side of that balance.
Supply and demand
Demand rises when more participants want to hold a coin, and supply matters through how many units are available to sell. Because Bitcoin has a hard cap of 21 million coins, its long-run supply is limited by design, which is one reason supply features so prominently in discussion of that coin. Most other coins have their own supply rules, so do not assume the same logic applies.
Sentiment, adoption and the wider economy
The Infinox guide lists several influences on demand. Sentiment covers news, regulatory announcements and social media trends. Adoption reflects how widely a coin is used. Macroeconomic factors include global inflation rates, interest rate changes and geopolitical events. These groups overlap, and a single headline can touch several at once.
When prices fall, the cause is usually a mix of these forces rather than a single event, and why is crypto going down works through that reasoning. The useful habit is to ask which side of the balance moved: did demand weaken, or did something change the willingness of holders to sell?
Volatility as a feature of the market
Infinox calls crypto markets notorious for their volatility, with rapid and dramatic price swings. Thin liquidity makes this worse, because small trades move a thin market further. Why is crypto so volatile covers the causes in detail. For your own planning, volatility means two things: stay prepared for large moves against you, and be wary of reading a short run of gains as a trend you can rely on.
Large holders are another factor people raise when they explain sudden moves, and what is a crypto whale looks at how far that explanation holds up.
Market capitalization, supply and rankings
Market capitalization is a size measure built from a coin’s price and its supply. It is the number most rankings use to order coins from largest to smallest, and it is easy to misuse, so it pays to know what it does and does not tell you.
What market cap shows
Market cap lets you compare the overall size of different coins in a single list, which a bare price cannot do. A coin with a low unit price can be larger than a coin with a high unit price once supply is taken into account. What is market cap in crypto explains the calculation and its limits.
Supply terms behind the number
The supply figure used in a market cap matters. Circulating, total and maximum supply measure different things, and the choice changes the result. Circulating supply vs total supply vs max supply sets out the differences, and what is fully diluted valuation crypto explains the related valuation that assumes the whole supply exists.
The decision point for a reader is straightforward. When you compare two coins, check that both figures use the same supply definition and the same date. A mismatch can make one coin look larger or smaller than it is, and a ranking is a snapshot that can reorder quickly.
Using rankings sensibly
A ranked list is a convenient starting point for orientation, not a recommendation. Size says little about quality, and it says nothing about whether a price is fair. If you want to see how the leading coins are ordered, the top cryptocurrencies by market cap page covers rankings and how they change.

Bitcoin halvings and market cycles
A bitcoin halving is one of the few scheduled events in crypto, which makes it a common reference point when people discuss cycles.
What a halving does
Infinox describes halvings as periodic events that cut the new supply of bitcoin in half. They are tied to Bitcoin’s design, alongside the hard cap of 21 million coins. The effect is that new coins enter circulation more slowly after each halving, while the overall ceiling stays the same.
Using halvings with care
Because a halving is a known event, it is widely discussed in advance, and that attention is itself part of sentiment. Still, a reduction in new supply is only one side of the price balance. Demand, news and the wider economy continue to act, so a halving does not guarantee a price direction. Treat claims that a past pattern will repeat as opinion, not as a rule.
Broader swings in interest across coins are sometimes called seasons. What is altcoin season explains that idea, and the same caution applies: a label describes what has happened, and it does not forecast what comes next.
Crypto markets compared with stock markets
The main contrasts are hours, how transactions are verified, and who stands behind the asset. The table sets out the supported differences.
| Feature | Crypto markets | Traditional comparison | Planning use |
|---|---|---|---|
| Trading hours | 24 hours a day, seven days a week | Stock markets do not operate around the clock | Expect price changes while traditional markets are shut. |
| Verification | Transactions do not require a bank or financial institution to verify them | Banks and institutions play that role | Know that you are responsible for your own access and security. |
| Backing | No government, bank or financial institution controls it | Traditional currency is backed by government | Read the issuer’s terms for any coin that claims stable value. |
| Regulation | Described as absent from the market, though crypto is a taxable asset | Government regulation applies to traditional markets | Check the rules and tax treatment where you live. |
The comparison draws on Infinox for hours and Coursera for verification, backing and regulation.
The headline difference is hours, but the practical one is protection. Coursera says government regulations are absent from the cryptocurrency market, while still noting that crypto is a taxable asset. Rules and enforcement vary by country and change over time, so check your own regulator’s investor-education pages before you commit money. For a longer comparison, see how is crypto different from stocks.

Reading prices and data with a snapshot mindset
Charts are the main window into the market, and they are only as useful as the habits you bring to them. How to read crypto charts covers candles, scales and time frames.
- Date every figure. A price, volume or ranking is true for a moment. Record when you read it, and re-check before relying on it.
- Compare like with like. Use the same source, the same supply definition and the same time of day when you set coins or periods side by side.
- Check depth before size. For larger orders, look at the spread and the order book, since both show how much a price might move when you trade.
- Separate drivers from noise. Ask whether a move reflects a change in supply, demand, sentiment or the wider economy before you read meaning into it.
Where to start
Your first step depends on what you need to decide. Use this list to choose a path.
- If you are new to the market: begin with trading hours and the order book, so you understand that the market never closes and your order meets other orders.
- If you are comparing coins: start with market cap and supply definitions, so rankings do not mislead you.
- If you are planning a larger trade: focus on liquidity, the spread and slippage before anything else.
- If a price move worries you: work out which driver shifted, and keep in mind that volatility is a normal feature of this market.
Frequently asked questions
When is the next bitcoin halving?
Halvings are periodic, but no date is fixed in this overview. Any date you read is an estimate from the day it was published, so confirm it against live Bitcoin protocol data or a block tracker.
Do banks verify crypto transactions?
No. Coursera describes cryptocurrency as digital money that does not require a bank or financial institution to verify transactions, with the blockchain acting as the ledger.
Is crypto taxable even though it is lightly regulated?
Coursera says government regulations are absent from the market, yet crypto is a taxable asset. Local tax rules differ, so check your tax authority.
Can a small trade move a price?
It can in a less liquid market. Keyrock notes that less liquid assets can see substantial price swings, while market makers help reduce price impact.
What is a spot trade?
It is a purchase or sale of a digital currency at its current market price, which Coinbase says executes when it matches an order in the order book.