
Reading a crypto chart can be daunting. Heck, if they were easy, you probably wouldn’t be here – but hey, we’ve got your back.
Whilst at first they can appear quite confusing, they are actually rather simple to read.
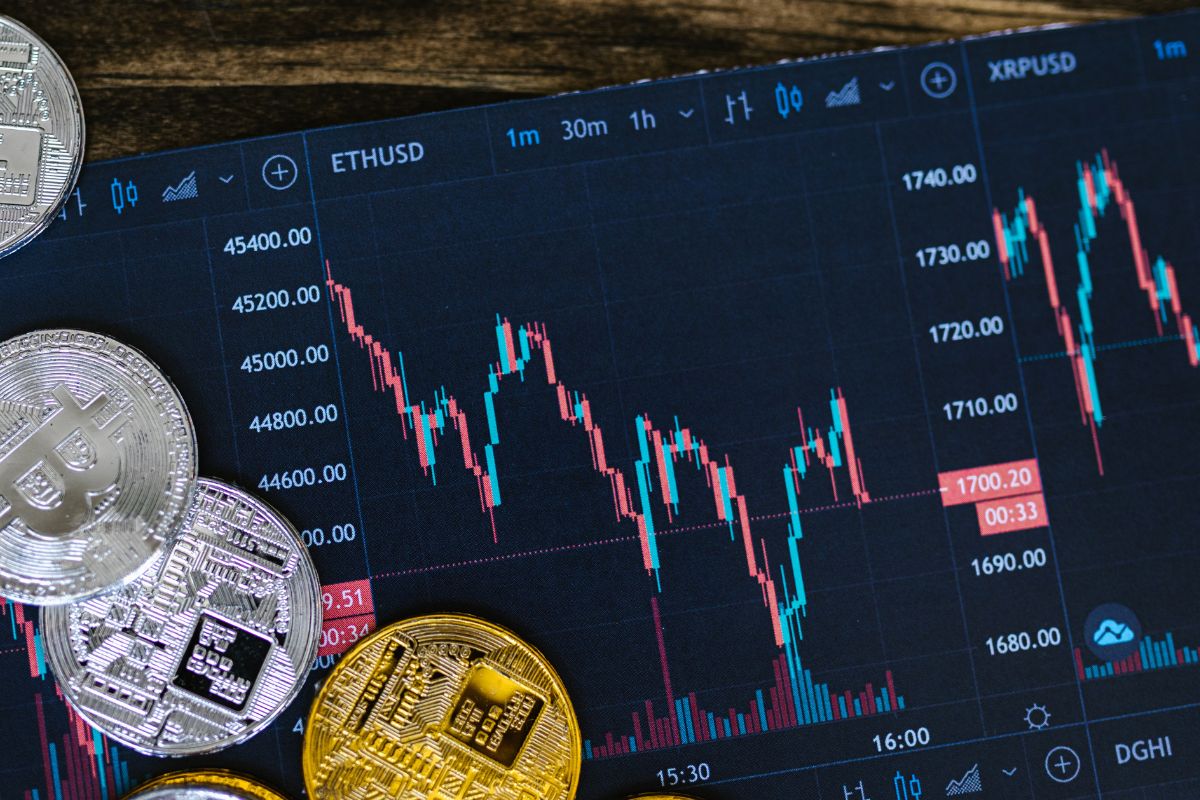
One of the key areas you will want to take note of is the price action.

This is because it shows you the different crypto prices which are usually shown either as a candlestick chart or line.
If you are interested in cryptocurrency, whether that is dabbling in it or just following the market, then you will need to know how to read a crypto chart.
Whilst you may understand the process of a blockchain, market trends and technical analysis is another thing entirely.
In this article we shall take a look at understanding the points of a crypto chart, and how to read the crypto chart.
So, let’s get to it!
Understanding Crypto Charts
When it comes to a crypto chart, you are going to want to look at a few key areas of cryptocurrency to really understand how it works.
So, let’s take a look at them:
Crypto Positive And Negative News
Keeping your eye on crypto news is the best way to stay in the know when it comes to movements of price.
An example of this is when you see positive crypto news. This means that there is a likelihood that the price of the crypto will rise.
However, you should also take note if the news about the crypto is negative. If it is negative, then it is highly likely that the price of the crypto will decrease.
Identifying The Price Trend Of Crypto
Over time you will want to see how the prices of crypto are doing. This will show you what the price trend is over a certain amount of time.
For example, if you notice that the prices of the crypto is rising consistently, then the crypto is said to currently be in a ‘bull market’.
If the prices of crypto are declining and falling, then it is said that the crypto is currently in a ‘bear market’.
Volume Of Crypto
To identify different trends within the crypto market, you will want to look at the volume of crypto that is traded during a specific amount of time.
If the volume appears to be low, then it becomes quite obvious that this particular crypto isn’t being traded as much, or at all.
If the volume is high, then you can feel rest assured that there is quite a lot of interest when it comes to the trading of this crypto.
How Does A Crypto Chart Work
To understand how the crypto chart works, you will need to look at the three different sections which they are normally divided into.
These are:
- Candles
- Indicators
- Order book
So, what do these even mean? Let’s take a look at them in detail:
Candles
If you want to see the price actions, then the candles are the place to look.
These will show you the pricing trend during a specific time period. So for example, the candles will be colored either red or green, depending on whether the price is up or down.
The wicks of the candles indicated bothe the lowest and highest prices that have been reached.
Indicators
Whilst you do not need to know mathematical formulas, this bit shows what math has been used to identify the different trends during the movement of price of the currency.
The ones that prove to be most popular are the average moving, the ‘relative strength index’, and the ‘stochastic oscillator’.
Order Book
The order book is basically a list of the sell and buy orders for different cryptocurrency that is available. Here you will be able to see what it is being both bought and sold at.
Here you can look at the different levels of resistance of the price of currency, which is very useful in the long run. It means it will show you the highest end of its value before the price decreases again.
Movements Of A Crypto Chart
The chart you will have likely seen is the Japanese candlestick version which shows both red and green ‘candlesticks’.
These show how the price of crypto has moved during a particular time frame.
The body of the candlestick represents the closing and opening price, with each line at the top and bottom showing the highest and lowest price during that time frame.
What the candlestick uses as a whole is trend lines, so let’s take a look at them in more detail.
Understanding Trend Lines
The trend lines of a crypto chart help to identify the different trends.
It can be shown as a line going up or down, that intersects between around two different price points at the very least.
For it to be strong, it will be able to pass as many points as possible – however, so long as it passes through two and has a third to give it validation, that the outcome stands.
It also needs to be spaced out, and not like a horizontal line.
What Does A Trend Line Mean?
A trend line is useful because it allows for you to see how the crypto is doing, and how it may move going forward. It allows you to invest using informed choices, which is less risky than going in blind.
Drawing trend lines does have its disadvantages though, as just like with all tools for cryptocurrency, they aren’t foolproof.
They have been designed to help you as you invest or take interest in crypto.
Final Thoughts
Whilst at first a crypto chart may look daunting, it is actually really easy to follow.
The biggest thing you need to understand is what the candlesticks mean, and how this shows you something like a price trend.
With this information in mind, you can make better informed decisions if you are planning to invest. Hopefully this article has helped you learn the basics.
- Is It Too Late To Invest In Bitcoin? - June 17, 2022
- How To Calculate Bitcoin Profits - June 17, 2022
- How To Buy Crypto On Venmo - June 17, 2022


